
Microsoft Office programs have features suitable for every usage area. The easily installed programs on Microsoft and Mac operating systems come to the fore with their functionality. Excel, which is among them and seems complicated, is generally used to create tables or do calculations. Preferred as a statistical, engineering, and computational tool, it eases the challenges. It allows you to do almost every mathematical operation comfortably via the computer. It offers professional image editing skills thanks to its time-saving advanced features. It is an ideal program to visualize the calculations made. With Excel education, you can make your life practical.
Excel, the spreadsheet program, offers many formulas, data, symbols, numbers, and numbers. It establishes healthy communication between tables or cells. This software, which is frequently used in the business world, helps you make cycles such as graphics and calculation, especially analysis and reporting. Excel, which is used in every business, whether small, medium, or large, is also preferred for personal work. From the first day of its release, it continues its life with its functional richness. The usage area is quite common. It provides efficient use with unique formulas. Well, have you ever thought about how to make your life easier with Excel? It saves time by offering you numerous advantages with its Excel features.
Uses of Microsoft Excel
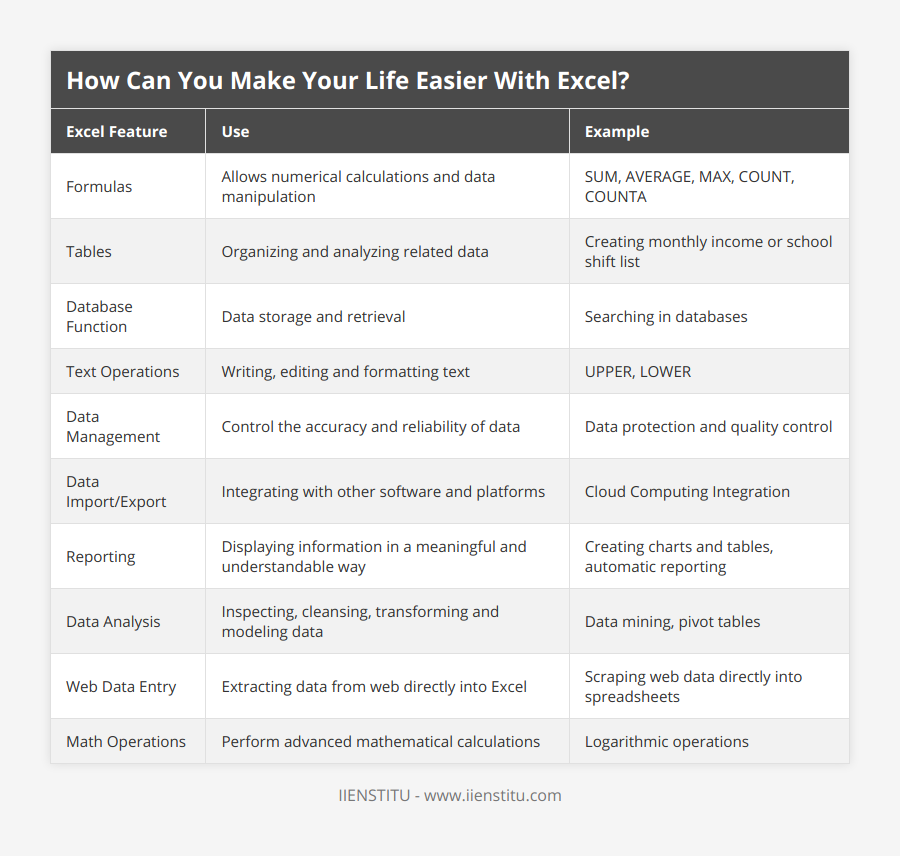
It converts any file located on your computer into spreadsheets. You can create your monthly income or prepare the school shift list. Excel, which is used in private life, is frequently preferred by computer users in business life. Tables created with Excel replace those made by hand. This brings along an efficient working environment. Thanks to this program, you can reach the results quickly. Because Excel offers some formulas to its users.
Some examples of operations with Excel;
Calculation With Formulas,
Formula Creation,
Creating Independent Tables,
Using It As A Database
Searching In Databases,
Text Writing,
Serialization,
Doing Math Operations
Add Picture,
Data Management And Protection Of Quality,
Export And Import,
Cloud Computing Integration,
Automatic Reporting And Report Calling,
Data Mining,
Excel To Web Data Entry,
Do Not Perform Logarithmic Operations.
Formula Examples from Excel
Operations in Excel are carried out using formulas. The common feature of all formulas is that they begin with an equal sign. When capitalizing letters, colons are used to process sequential sentences. Semicolons allow you to line up different cells. Formulas;
SUM: Addition,
AVERAGE: Average of selected values,
MAX: The largest deal,
COUNT: The number of cells, regardless of whether they are full or empty,
COUNTA: Number of cells containing data,
IF: Create response based on condition,
CONCATENATE: Merge input from two different cells,
VLOOKUP: Matching data,
UPPER or LOWER: Change letters from uppercase to lowercase or lowercase to uppercase,
MATCH: Finding the rank of a given expression,
ROUND: Round up or down when there is a long digit after the comma,
INDEX: Taking the values in a table and calculating in another field,
SUMIF: Summing only certain parts that are necessary for tables with many data,
LENGTH/LEN: Number of characters of text or numbers,
NOW: Display the current time as a date or time.
How to Create a Report in Excel?
Reporting with Excel is done using graphs and tables. Reporting, which is among the sine qua non of the business world, is diversified according to its intended use. For example, while companies prepare reports for customer analysis, the store manager prepares a sales report and calculates monthly earnings. The advanced Excel course is perfect for working with charts. To generate a chart report, you need to click on Excel's add and suggested charts button. You can organize reports with Pivot Tables. First, you need to click on add and then the Pivot Table button. You can specify the date range you want to analyze in the Table/Range field. With Excel reporting training, you can improve yourself and make your business life easier.
Creating Basic Charts and Tables in Excel Reports
To create a report, you first need to do good research. After collecting the data, you can present them on a single page. The easiest way to report in Excel is with graphs and tables. You can select the type of chart you want to add to the report in the charts group from the select and insert menu. Next, you need to click on the graphic design and data group button. You can specify all cells, including the title, by selecting the data and the sheet containing the data. Charts and graphs are updated when you paste new data into datasheets.
Pivot Tables are among the powerful tools of Excel reporting logic. You can select the data on the page you want to analyze and add the Pivot Table. After specifying the data range, you must also select the first cell in the worksheet you want to go to and finish. After the table creation process is completed, the data transferred from the source page becomes visible. With this method, you can analyze the source data and display the data you need as a Pivot Table.
How to Print Excel Reports?
You can add the reports you create to the archive by putting them on paper. So, how can you transfer it to paper? You can start by clicking the Select menu Text and Header buttons. Next, you need to type the title of the report page and format it slightly larger than usual. By the way, you can hide the sections that you do not want to include in the report by clicking the Hide tab. Finally, you can start the printing process by clicking the Print button from the File menu. You can print the information as paper or PDF as separate pages. You can also send it by e-mail if you wish.
Tips We Need To Know To Create Excel Reports
Some Points To Know To Create A Report;
Chart Types,
Functions Such As If, Vertical, Index-How Many, Multisum, And Polycounter,
Mastery Of PivotTable Details Such As Pivot Table And Using Slicers,
Checkboxes And Option Buttons
Excel Tips That Help You In Every Field
Excel tips that make your work and daily life easier;
Selecting all columns with Ctrl and A,
Opening all files at the same time by selecting the required files and pressing the Enter key,
Switching between different files with Ctrl and Tab,
Repeating operations with Ctrl and Y,
Shift and Space to select a line,
Ctrl and F find words and data,
Ctrl and H to find and replace,
F12 save as,
Ctrl and Space to select a column,
Ctrl and Left Arrow key to go to row, Ctrl and Up Arrow to head of the column,
Adding a hyperlink by pressing the Ctrl, Alt, and K keys at the same time,
Ctrl and Down Arrow key to go to the column, Ctrl and Right Arrow key to the end of the line,
A new Page opens with Shift and F11.
Frequently Asked Questions
What are the key factors that contribute to climate change?
Key Factors Contributing to Climate Change
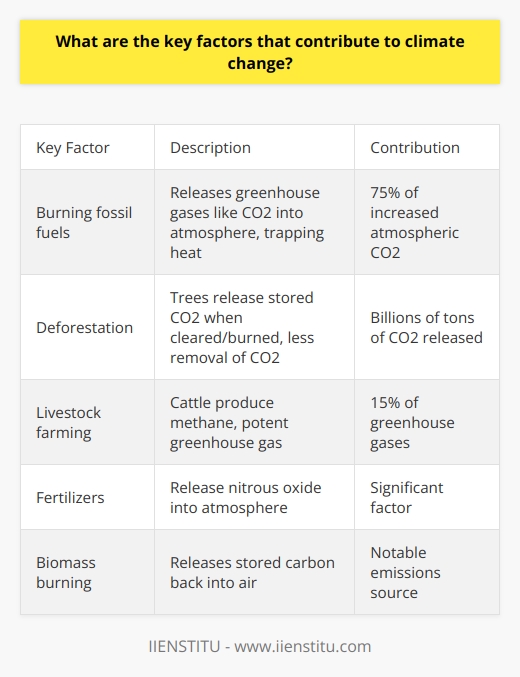
There are several key factors that contribute significantly to climate change. The most significant is the burning of fossil fuels such as coal, oil and natural gas. When fossil fuels are burned, they release greenhouse gases like carbon dioxide and methane into the atmosphere. These greenhouse gases trap heat from the sun, causing global temperatures to rise.
Deforestation is another major factor. Trees absorb and store carbon dioxide. When forests are cleared, that stored carbon is released. Deforestation also reduces the number of trees available to remove carbon dioxide from the air. Between 2015 and 2020, the world lost over 4 million hectares of forest per year.
Intensive livestock farming generates significant greenhouse gas emissions. Cows and sheep produce methane as part of their digestive process. Large scale cattle ranching leads to deforestation too. The livestock sector accounts for around 15% of global emissions.
Other contributors are fertilizers containing nitrogen and the burning of biomass. Overall, human activities are responsible for almost all of the increase in greenhouse gases over the last century. To mitigate climate change, we must transition from fossil fuels to renewable energy and prevent further deforestation. We must also reduce emissions from agriculture and other sources.
How does gender inequality manifest in different cultures?
Manifestations of Gender Inequality
Gender inequality refers to unequal treatment or perceptions of individuals based on their gender. This manifests in various ways across cultures. In many cultures, traditional gender roles cast women as caregivers and men as leaders. This leads to inequalities in domestic duties, employment, and positions of authority. For example, in parts of South Asia, women spend much more time on unpaid domestic work than men. In Saudi Arabia, strict laws prohibit women from traveling or working without a male guardian's permission.
Gender discrimination in education also perpetuates inequality. In Afghanistan, girls face barriers to attending school including lack of facilities, child marriage, and Taliban restrictions. Only 37% of Afghan girls complete primary education, compared to 66% of boys. This lack of education limits women's ability to participate in society.
Violence against women is another manifestation of gender inequality. Practices like female genital mutilation in parts of Africa, acid attacks in Southeast Asia, and honor killings in the Middle East target and control women. Up to 38% of murders of women worldwide are committed by intimate partners. Laws and enforcement often fail to protect women.
While many cultures have embedded gender inequalities, increased education for women and girls, activism, and legal protections are working to promote equal rights. Achieving gender equality requires changing long-held biases and practices.

What policies can governments implement to reduce poverty?
Policies to Reduce Poverty
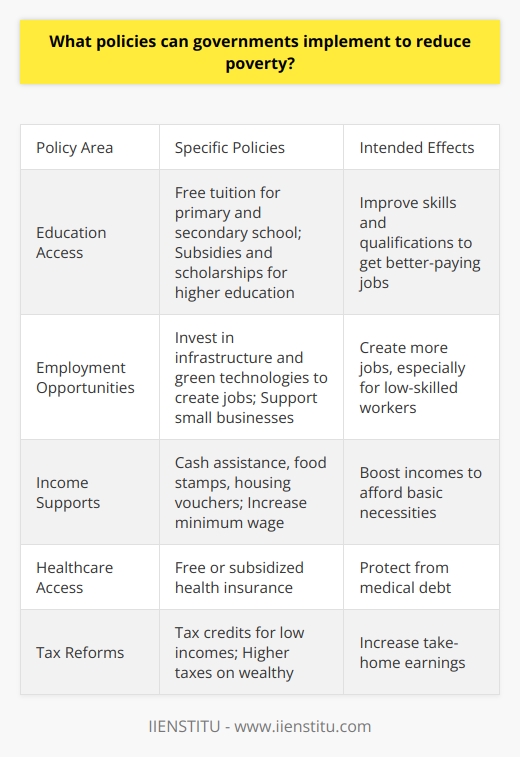
Governments can implement several policies to help reduce poverty. One important policy is to increase access to education. Governments can make primary and secondary education free and compulsory. They can also provide subsidies and scholarships to help low-income students attend college or vocational schools. Education gives people the skills needed to obtain better-paying jobs.
Another policy is to create more jobs and improve wages. Governments can invest in infrastructure and green technology to create construction and manufacturing jobs. They can set higher minimum wages and strengthen unions to improve pay. Policies that support small businesses can also lead to more job creation.
Governments can also strengthen social safety net programs. They can provide cash assistance, food stamps, and housing vouchers to help families meet their basic needs. Healthcare subsidies can make insurance more affordable. Increasing funding for childcare, disability, and unemployment benefits further aids those struggling financially.
Lastly, governments can reform tax policies to ease the burden on lower-income households. They can make tax systems more progressive by increasing taxes on the wealthy. Tax credits like the Earned Income Tax Credit can supplement wages for workers. Reducing regressive payroll and sales taxes helps increase take-home pay.
Implementing a mix of education, job creation, safety net, and tax reform policies can significantly reduce poverty. A comprehensive approach addresses both the symptoms and root causes of financial hardship for low-income families and individuals.
How can you make your life easier with excel free
Using Excel for Free to Improve Productivity
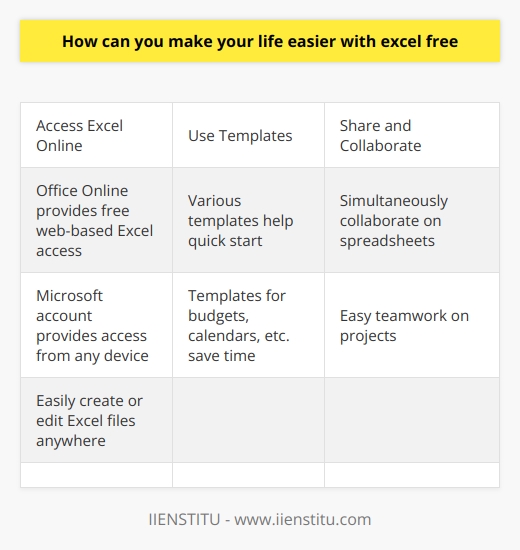
Access Excel Online
Use Templates
Share and Collaborate
Use Basic Functions
Sync Across Devices
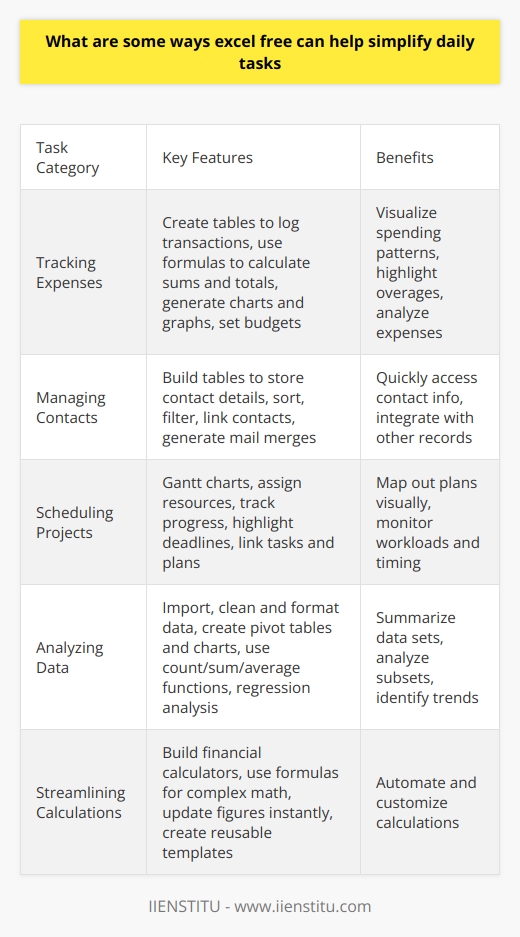
What are some ways excel free can help simplify daily tasks
Tracking Expenses
Managing Contacts
Scheduling Projects
Analyzing Data
Streamlining Calculations
In what ways can someone benefit from using excel free?
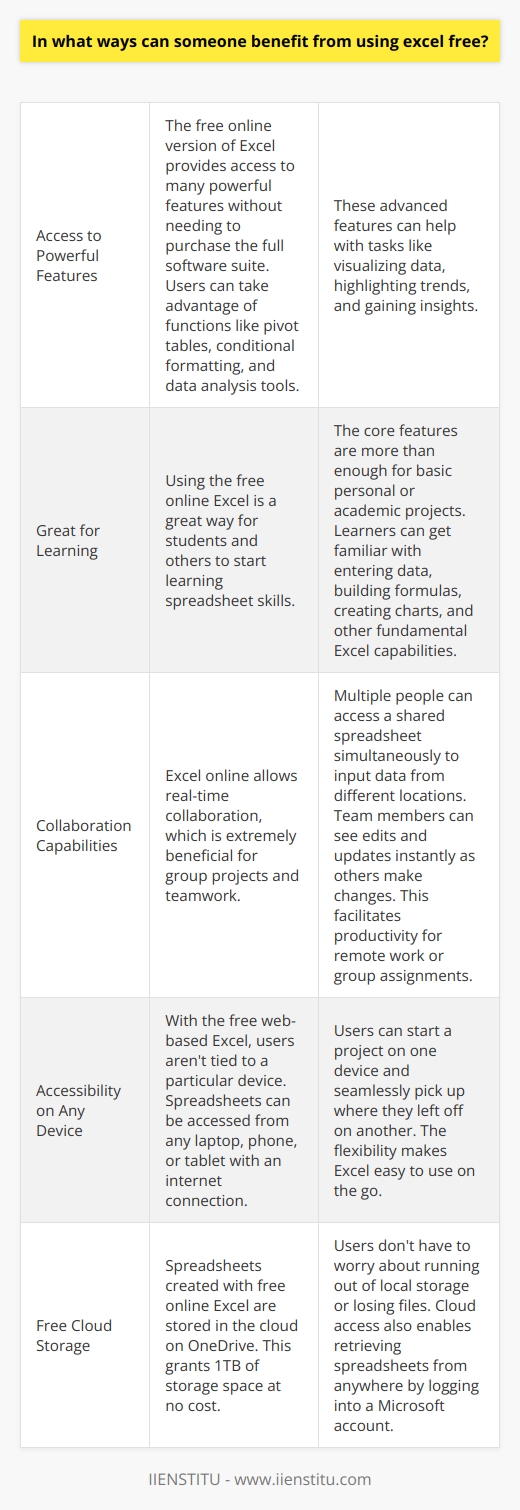
Benefits of Using Excel for Free
Microsoft Excel is one of the most popular spreadsheet programs used today. The basic version of Excel is available for free as part of Microsoft's Office web apps. Using Excel for free provides many benefits for personal and academic purposes.
Accessibility
Since Excel is free, anyone can access it easily. They do not need to purchase the full Office suite. Excel online allows users to create, edit, and share spreadsheets from any device with an internet connection. The no-cost access makes it a great option for students and others on a budget.
Core Features
Excel online provides core spreadsheet features for free. These include creating charts and graphs, using basic formulas and functions, and analyzing data. Users can enter data, format cells, sort, filter, and create simple calculations. The free tools give a good foundation for learning spreadsheet skills.
Collaboration
With Excel online, multiple people can view and edit the same spreadsheet simultaneously. This allows for easy collaboration on projects and documents. Team members can input data from separate locations and see updates in real-time. The collaborative abilities are ideal for group assignments and remote work.
Cloud Storage
Spreadsheets made with Excel online are saved in the cloud on Microsoft OneDrive. This provides 1TB of free storage space. Users can access their Excel files from any location or device by logging into their Microsoft account. The cloud storage makes it easy to pick up working where you left off.
Conclusion
In summary, Excel online gives free access to essential spreadsheet features. It enables remote collaboration and cloud storage. Using Excel for free is beneficial for students, individuals, and teams needing basic spreadsheet functions without the cost of Office. The accessibility and capabilities make Excel online a worthwhile option for personal and academic tasks.
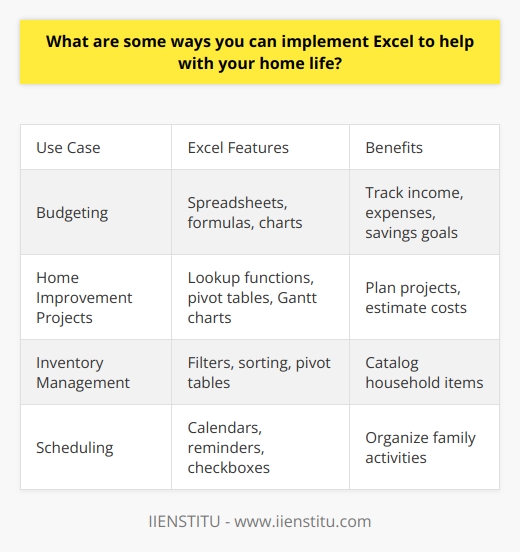
What are some ways you can implement Excel to help with your home life?
Using Excel for Home BudgetingExcel is a versatile program that can be utilized in various aspects of home life. One of the most common uses is tracking personal or household budgets. Excel's spreadsheet format allows users to neatly organize income, expenses, savings goals, and more. Individual or joint bank accounts can be listed with automatic formulas to tally spending in categories like food, utilities, entertainment, etc. Excel formulas enable users to quickly calculate sums, percentages, and see where money is being allocated. Charts and graphs can be generated to visualize spending trends over time. Debt payments and savings contributions can also be tracked.
Managing Home Maintenance and Improvement ProjectsIn addition to finances, Excel is helpful for home improvement and maintenance projects. Lists of tasks, required materials, and associated costs can be created. Data validation can ensure data is entered correctly. Lookup functions match project components. Pivot tables filter and summarize project details. Gantt charts lay out project timelines. Formulas calculate total costs and labor hours for budgeting. Photos and drawings can be inserted to supplement project plans. Excel helps optimize planning so improvement projects run smoothly.
Organizing Household InventoryExcel is a great tool for cataloging household items and inventory. Families can create sheets to log food, clothing, toys, books, etc. Columns could include item name, quantity, size, purchase date, and location. Filters and sorting allow users to quickly find specific items. Pivot tables summarize inventory by category. Formulas track quantities and notify when items need replenishing. Hyperlinks can connect to product details online. Images help identify items visually. Keeping an Excel inventory helps families stay organized and save money by reducing duplicate purchases.
Scheduling Home Activities and Chores With family schedules getting busier, Excel can be utilized to track and assign home activities. Calendars outline school, work, extracurriculars, and appointments. To-do lists capture household chores like cooking, cleaning, yardwork, etc. Assigning tasks to individuals provides accountability. Checkboxes allow tracking completed actions. Reminder alerts can be set. Charts display task progress and time spent. Scheduling in Excel brings order to hectic home lives.
In summary, Excel is a versatile digital tool that can be utilized to organize finances, manage home projects, catalog inventory, schedule activities, and bring greater structure to busy home lives. Its spreadsheet format, formulas, filters, charts, and other features enable families to work more efficiently. Implementing Excel can optimize home management.
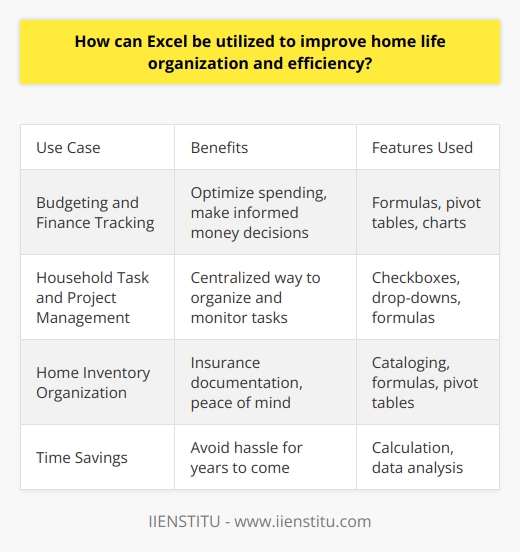
How can Excel be utilized to improve home life organization and efficiency?
Excel is a powerful spreadsheet program that can help improve organization and efficiency in various aspects of home life. With its calculation, graphing, and pivot table features, Excel enables users to track, analyze, and visualize data in ways that promote productivity.
Budgeting
One of the most useful applications of Excel in the home is budgeting and tracking finances. Excel's formulas allow for quick calculations of sums, differences, percentages, etc. Expenses can be input into various categories with formulas tallying spending by month, quarter, or year. Pivot tables and charts provide visual summaries of spending patterns. Goals can be set for saving and debt reduction. Formulas show progress towards goals and quickly indicate overspending.
Household Management
In addition to finances, Excel can track other household tasks and responsibilities. Chores, shopping lists, project to-do lists, maintenance schedules, and family calendars can be created. Checkboxes allow for marking items complete. Charts illustrate task completion. Reminders and due dates can be set. All information remains in one centralized location.
Home Inventory
Excel is useful for cataloging household possessions for insurance purposes. Fields can include item name, description, serial number, purchase price, purchase date, and photo. Formulas can calculate total value. Pivot tables can summarize by room. Hyperlinks can connect to receipts or manuals stored on a hard drive. A home inventory provides peace of mind and facilitates insurance claims in the event of damage or theft.
In summary, Excel's powerful features like calculations, pivot tables, and charts can improve home life organization and efficiency in finances, chore management, and home inventory. With some set-up time invested, Excel can provide long-term benefits for productivity and peace of mind.
In what ways can Excel be applied in the home to assist with budgeting, scheduling, and other household tasks?
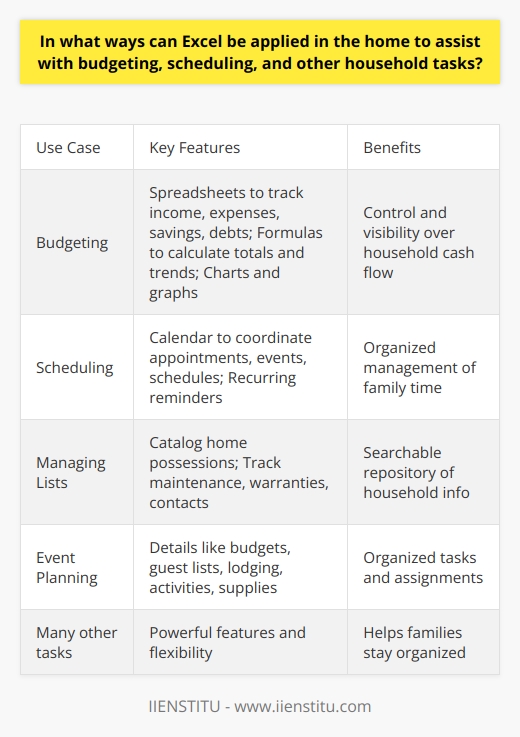
Excel is a versatile program that can assist with many household tasks. Its spreadsheet format allows users to neatly organize information in a tabular manner. Excel has features to help with budgeting, scheduling, managing lists, planning events, and more.
Budgeting<br>Excel is very useful for budgeting at home. Users can create a worksheet to track income, expenses, savings, and investments. Formulas can calculate totals and percentages. Charts visually display spending trends over time. Conditional formatting highlights over-budget items. Excel helps manage household finances.
Scheduling <br>Schedules are easy to build and modify in Excel. Families can use it to track school, work, extracurricular, and social commitments in a calendar view. Excel can also schedule recurring tasks like chores, with reminders. It helps coordinate everyone's activities.
Managing Lists<br> Excel is perfect for creating household inventories and lists. It can catalog possessions for insurance purposes. Users can list home maintenance tasks, warranty information, utility accounts, and emergency contacts. Excel keeps important household data organized.
Event Planning<br> Planning family events like vacations, parties, and holidays is simplified with Excel. It can manage guest lists, budgets, itineraries, lodging, transportation, food/drink, supplies, and more. Excel helps organize all the details in one place.
In summary, with its powerful spreadsheet capabilities, Excel is extremely useful for budgeting, scheduling, list-making, event planning, and other household tasks. Its flexibility allows families to customize it to their specific needs. Excel helps households stay organized and work more efficiently.
What are the top ten most useful Excel features?
Excel is a powerful spreadsheet program that offers many useful features for data analysis, visualization, and reporting. Some of the most useful Excel features that improve productivity and enable deeper data insights include:
PivotTables
PivotTables allow users to summarize, analyze, explore, and present data in a tabular format. They make it easy to rearrange rows and columns, filter data, group items, and calculate sums or averages. PivotTables are useful for quickly generating reports and finding patterns in large datasets.
Lookup functions
Lookup functions like VLOOKUP, HLOOKUP, and INDEX MATCH allow users to find and extract data from other sheets or tables. This allows data from multiple sources to be combined and compared. Lookups are essential for linking data sources and automating analysis.
Conditional formatting
Conditional formatting applies formatting like color scales, data bars, and icon sets to cells based on defined rules or criteria. This provides visual representations of data trends, outliers, and patterns. It improves readability and highlights insights.
Data validation
Data validation restricts data entry in cells to certain values, numbers, dates, or text. This improves data accuracy and consistency for downstream analysis. Input messages and error alerts can also guide users.
Tables
Tables allow users to manage and analyze related data sets. Structured references make it easy to reference table data in formulas. Tables can be filtered, formatted, expanded, and updated easily while maintaining integrity.
Charts
Charts like column, bar, line, pie, and scatter plots turn Excel data into graphical representations. This makes data trends and relationships more intuitive and impactful for reports and dashboards.
Formulas
Formulas allow calculations and analysis to be applied to data. Simple formulas can automate basic tasks while advanced nested formulas enable complex analyses. Excel includes statistical, logical, lookup, and financial formulas.
PivotCharts
PivotCharts combine PivotTables and charts to quickly generate graphical representations of summarized data. They allow flexible exploration and visualization of complex data sets.
Power Query
Power Query lets users import, combine, and transform data from many sources. It simplifies data cleaning and shaping prior to analysis. Queries can be reused and automated.
Macros
Macros automate repetitive or complex tasks through recorded actions. This saves time and minimizes errors. Macros can customize workflows and processes within Excel.
What Excel features allow users to analyze data most effectively?
Excel includes many features that enable users to effectively analyze data. Three of the most useful features for data analysis are pivot tables, formulas, and charts.
Pivot tables allow users to summarize, analyze, explore, and present data in a flexible manner. Pivot tables can automatically sort, count, total or average the data stored in one table or spreadsheet. This allows users to see comparisons, patterns and trends in the data. Pivot tables enable users to ask new questions of their data simply by dragging and dropping fields. Pivot tables are powerful for summarizing large amounts of data and analyzing data from different perspectives.
Formulas are essential for performing calculations on data in Excel. Formulas allow users to create new metrics or KPIs, normalize data, do statistical analysis, and more. Some helpful formulas for data analysis include SUM, AVERAGE, MAX, MIN, COUNT, COUNTIF, VLOOKUP, and IF statements. With formulas, users can gain new insights into their data.
Charts or graphs visualize data trends, comparisons, and relationships. Excel provides numerous chart types including column, bar, line, pie, scatter plots, and more. Visualizations make it easier to understand large amounts of data. Charts allow users to quickly identify patterns, outliers, and areas for further analysis. Users can create clear, meaningful charts from their data that highlight key insights.
In summary, pivot tables, formulas, and charts are integral Excel features for data analysis. Pivot tables summarize and explore data from different viewpoints. Formulas generate new metrics and insights. Charts visualize trends and patterns. Using these features together enables users to effectively analyze data in Excel.
Which of the top ten Excel features help improve productivity?
Excel is one of the most widely used spreadsheet programs in the world. It offers many powerful features that can help improve productivity for a variety of tasks. Of Excel's top ten features, the most useful for boosting productivity include pivot tables, keyboard shortcuts, conditional formatting, data analysis tools, macros, templates, collaboration tools, sparklines, charts, and formulas.
Pivot tables allow users to summarize, analyze, explore, and present data in a flexible manner. They can automatically sort, count, total or average data stored in one table or spreadsheet. Pivot tables are highly useful for quickly generating reports and insights from large datasets. Keyboard shortcuts speed up work by reducing mouse usage. Shortcuts for formatting, navigation, formulas, etc. help improve efficiency.
Conditional formatting visually highlights cells that meet certain criteria, aiding in data analysis. This allows quick identification of trends, patterns, and outliers. Excel's data analysis tools like sorting, filtering, consolidation, what-if analysis, goal seek, and scenarios simplify data manipulation and analysis. Powerful built-in formulas help perform calculations for financial, statistical, logical, lookup, and text functions.
Macros automate repetitive tasks through recorded actions and Visual Basic for Applications (VBA) programming. This reduces workloads and ensures consistency. Templates provide pre-formatted spreadsheets for common tasks like budgets, schedules, invoices, etc. This removes the need to create new files from scratch.
Collaboration features like track changes, comments, and sheet protection facilitate teamwork. Multiple authors can edit spreadsheets together. Sparklines give compact visual representations of trends alongside cells. Charts turn data into clear graphs and diagrams. Overall, Excel's versatile features streamline number crunching, analysis, reporting and visualization - leading to improved productivity.
How do you create a pivot table in Excel
A pivot table is a useful tool in Excel for summarizing and analyzing data. To create a pivot table, first select the data you want to include. This can be a single data range, multiple ranges, or an entire Excel table. Next, go to the Insert tab and click PivotTable. In the Create PivotTable window, verify the range is correct and click OK. Excel will automatically create a new worksheet with a blank pivot table.
Once the blank pivot table is created, you need to add fields. On the right side of the pivot table, click and drag fields from the PivotTable Field List into the different areas. Drag the fields you want summarized into the Values area. Drag the fields you want to group the data by into the Rows and Columns areas. You can also filter the data by dragging fields into the Filters area.
After adding fields, you can customize the pivot table layout. For example, you can right-click on a field name and select Field Settings to change the summary function, number formatting, etc. You can also click the pivot table Analyze tab to add calculated fields, group data, refresh the data source, and more. Additionally, you can change the display by toggling between pivot table and pivot chart views.
Some tips when working with pivot tables: organize the source data in a tabular format with column headers; use unique values in the row/column fields to prevent double counting; refresh the pivot table when the source data changes; insert slicers to quickly filter the table; and create timeline slicers to filter by dates. Pivot tables are a dynamic tool for summarizing, analyzing, exploring, and presenting data.
What are some useful keyboard shortcuts in Excel
Excel includes many useful keyboard shortcuts that can help users work more efficiently. Some of the most commonly used shortcuts allow users to navigate worksheets and enter data quickly. The Ctrl + Arrow keys allow users to jump to the next cell in the direction of the arrow key. For example, Ctrl + Down Arrow moves one cell down, while Ctrl + Right Arrow moves one cell to the right. Using the arrow keys to navigate between cells is much faster than clicking on each cell manually with the mouse.
Keyboard shortcuts can also help users enter data more efficiently. The Tab key allows users to move one cell to the right once they are finished entering data in a cell. Shift + Tab moves one cell to the left. Enter places the cursor in the next row down in the same column. Ctrl + Enter places the cursor in the cell below the current cell. These shortcuts eliminate the need to reach for the mouse every time you want to enter data in a new cell.
Editing data is also faster with keyboard shortcuts. F2 edits the content of the current cell. Esc cancels an edit. Ctrl + Z undoes the last action, and Ctrl + Y redoes the last action that was undone. Being able to quickly undo and redo changes enables efficient data entry and editing.
Keyboard shortcuts can automate common Excel tasks as well. Ctrl + C copies the selected cells, and Ctrl + V pastes copied cells. Ctrl + X cuts selected cells. Ctrl + B bolds selected text or values, while Ctrl + I italicizes them. Alt + = automatically sums the cells above the selected cell. These shortcuts eliminate the need to navigate through menus to format cells or perform common commands.
Navigating between Excel worksheets and workbooks is faster with keyboard shortcuts too. Ctrl + Page Down moves one worksheet to the right, while Ctrl + Page Up moves one worksheet to the left. Ctrl + Tab cycles through all open Excel workbooks. Alt + F4 closes the current workbook. Being able to quickly switch between worksheets and workbooks is essential for efficient workflow.
In summary, keyboard shortcuts allow Excel users to navigate worksheets, enter and edit data, format cells, perform common commands, and move between worksheets and workbooks more efficiently. Mastering shortcuts can help users save significant time and effort in Excel.
How can you protect cells from being edited in Excel?
Protecting cells from editing in Excel can be useful for many purposes. When sharing workbooks with others, you may want to restrict editing of certain cells to prevent accidental or intentional changes. There are a few ways to lock down cells in Excel.
The most basic method is to lock specific cells. To do this, select the cells you want to lock, go to the Home tab, click the Format button in the Cells group, and choose Lock Cell. This will prevent anyone from editing the contents of those cells when sheet protection is turned on.
To activate sheet protection, go to the Review tab and click Protect Sheet. This opens a dialog box where you can set a password required to unprotect the sheet. Make sure the Select locked cells and Select unlocked cells boxes are checked. Locked cells cannot be edited when protection is on.
A more advanced option is to allow editing of some locked cells based on user permissions. First, ensure the cells you want to lock have their Locked property set to True under the Protection section of the Format Cells dialog box.
Then, select the Review tab and click Allow Users to Edit Ranges. Here you can specify cells that specific users are allowed to edit when sheet protection is enabled. This lets you customize editing permissions.
Finally, you can prevent all cells on a sheet from being edited while allowing formatting changes. On the Review tab, click Protect Sheet. Enable the checkbox for Allow formatting cells. This will let users change fonts, cell colors, etc, but not edit the contents.
In summary, locking cells, enabling sheet protection, and configuring user-based permissions allows extensive control over cell editing in Excel. Careful use of these features helps prevent unintentional changes to sensitive data.
What are some of the key capabilities of Microsoft Excel?
Microsoft Excel is one of the most widely used spreadsheet software programs. It offers a range of powerful features and capabilities that make it a versatile tool for many tasks. Some of the key capabilities of Excel include:
Data organization and management
Excel allows users to organize data into rows and columns. Large datasets can be managed by separating information into different tabs and worksheets. Excel enables sorting, filtering and analysis of data with features like pivot tables and formulas.
Calculations
Excel can perform basic calculations like addition, subtraction, multiplication and division. More advanced math and statistical functions are also available. Formulas allow users to carry out calculations across rows and columns. Excel updates results automatically when data changes.
Charting and visualization
Data can be presented visually in Excel using the charting capabilities. Many types of charts like bar, column, pie and line graphs can be created. Charts update when the underlying data changes. Visualizations make it easier to understand data.
Reporting and dashboards
Reports and dashboards can be generated by combining data, visualizations and other Excel features. Dynamic reporting allows information to stay up-to-date. Dashboards give managers an at-a-glance view of key metrics.
Financial functions
Excel has many built-in financial formulas for tasks like loan calculations, time value of money, depreciation, rate of return and more. This makes Excel useful for accounting and financial modeling.
Pivot tables
Pivot tables enable users to summarize, analyze and explore large datasets. Rows and columns can be manipulated to see data from different perspectives. Pivot tables are powerful for finding patterns and insights.
In summary, Excel is highly capable for tasks involving data analysis, visualization, reporting, financial modeling and more. Its flexibility allows it to be used across many sectors and industries.
How can Microsoft Excel be used to analyze data?
Microsoft Excel is a powerful tool for analyzing data. With its wide range of features and functions, Excel allows users to organize, calculate, visualize and share data in ways that reveal trends, patterns and insights. Some key ways Excel can be used for data analysis include:
Data Organization
Excel provides tools to neatly arrange data for analysis. Users can import data from external sources and easily structure it into rows and columns. Features like filtering, sorting and conditional formatting help users organize data as needed. PivotTables allow summarizing large datasets. Excel's data validation feature ensures data integrity.
Calculations
Excel performs calculations using formulas and functions. Basic formulas like sum, average and count provide simple analytics. More complex functions enable statistical, financial, logical and text analysis. Array formulas perform calculations across cell ranges. Excel's calculation engine leverages these to transform data into useful information.
Data Visualization
Visual representations make data easier to understand. Excel provides various customizable chart types like bar, line, pie, scatter plot and more. Charts help uncover trends and relationships in data. Sparklines provide mini charts inside cells. Slicers and Timelines filter data visually. Graphics, conditional formatting and SmartArt further visualize data.
Reporting and Sharing
Excel reporting tools turn analyzed data into actionable business intelligence. Features like Tables and PivotTables can be used to generate reports. Dashboards combine visualizations into interactive reports. Power View provides interactive visualization and reporting. Analyses can be easily shared via emails, presentations, workbooks and online Excel platforms.
With its powerful features, Excel allows users to derive valuable insights from data. It enables organizing, processing, visualizing and sharing data analytics to improve business decisions.
What types of visualizations and charts can be created using Microsoft Excel?
Microsoft Excel offers a wide variety of options for creating visual representations of data, including charts and graphs. Some of the most commonly used Excel chart types include column, bar, line, pie, scatter, area, surface, doughnut, radar, stock, treemap, sunburst, histogram, waterfall, Gantt charts, and PivotTables. Each chart type has specific uses and allows users to visualize data in different ways.
Column charts are effective for showing data trends over time or comparing multiple data series. They display categories along the horizontal axis and values along the vertical axis. Bar charts also compare values across categories but flip the axes, with categories on the vertical axis. Line charts connect data points to show trends and are useful for time series data. Pie charts demonstrate proportional relationships in a single data series. Scatter plots show the relationship between two value sets. Area charts emphasize the magnitude of change over time.
Surface charts show trends in two dimensions, like a topographic map. Doughnut charts are similar to pie charts but can contain multiple data series. Radar charts compare data on multiple quantitative scales. Stock charts plot major stock market indexes over time. Treemaps display hierarchical data using nested rectangles. Sunburst charts do the same in a radial format. Histograms group data into bins to show distribution. Waterfall charts show how positive and negative values contribute to a final amount.
Gantt charts display project schedules with tasks shown on a timeline. PivotTables summarize and reorganize data for analysis. They allow users to filter, group, and sort data dynamically. Tables can be refreshed when the source data changes.
Excel provides extensive formatting options for customizing chart appearance, including colors, fonts, backgrounds, 3D effects, and more. Charts and graphs can be embedded alongside data or placed on separate sheets. Overall, Excel's visualization capabilities allow users to quickly create meaningful graphical representations of complex datasets.
What are some of the key features covered in an article about Excel?
Introduction
Formulas
Charts and Graphs
Pivot Tables
Data Analysis
Conclusion
What are the benefits of reading an article about Excel?
Learning New Skills
Gaining Insights and Tips
Solving Problems
Learning New Applications
Staying Up to Date
How can someone use an article about Excel to improve their skills?
Learning Excel Skills from Articles
Reading articles about Excel can help people improve their skills with the program in many ways. First, articles often provide step-by-step instructions for using Excel features. Following detailed, sequential directions allows readers to learn new skills hands-on. For example, an article could explain how to make a pivot table, with screenshots of each click needed. By replicating the tutorial, readers gain firsthand experience with pivot tables.
Second, articles share tips and shortcuts for accomplishing tasks more efficiently in Excel. For instance, an article might explain keyboard shortcuts for navigating worksheets or built-in Excel functions for calculations. Learning these tricks saves time compared to clicking menus and toolbar buttons. Readers can boost productivity by applying the tips to their own work.
Third, articles suggest best practices for setting up spreadsheets and workflows. A well-designed spreadsheet is critical for organizing data and automating repetitive processes. Articles recommend structuring workbooks with separate tabs, formatting cells for clarity, using data validation to prevent errors, and more. Readers can improve the quality of their spreadsheets by following expert advice.
Fourth, troubleshooting guides in articles help fix common Excel problems. For example, if a formula is not calculating properly, a reader can search for solutions in an article. The instructions may explain possible causes, like incorrect cell references or precedence errors, and provide steps to correct the formula. Readers learn how to debug and fix issues independently.
Fifth, articles keep readers up to date on new Excel features and functions. Microsoft updates Excel regularly, so learning about capabilities like XLOOKUP, dynamic arrays, and more enables readers to take advantage of the latest tools. Readers can boost skills by adopting new, more efficient ways to accomplish tasks.
In summary, articles provide step-by-step tutorials, productivity tips, best practices, troubleshooting advice, and information on new features. By reading about Excel, users can expand skills, work more efficiently, design better spreadsheets, fix errors, and utilize the latest capabilities. Articles offer valuable guidance for continuously developing Excel expertise.